
We begin with the question: “Is it possible to develop an instrument in which Global Navigation Satellite Systems (GNSS) signals and astronomical source signals are sampled via the same signal chain, effectively ensuring that both measurements are made from the same antenna phase center?” If this were possible, then we might be able to process such measurements in conjunction with measurements from a Very Long Baseline Interferometry (VLBI)-like antenna. GNSS and VLBI are two space geodetic measurement techniques whose measurements are critical to the establishment of the International Terrestrial Reference Frame (ITRF). The accuracy and stability of the ITRF are critical for the high-accuracy, long term measurements needed to assess global sea level change.
We believe that better integration of the space geodetic techniques, which also include Satellite Laser Ranging (SLR) and Doppler Orbitography and Radiopositioning Integrated by Satellite (DORIS), is important for improvements in the terrestrial reference frame. The four techniques GNSS, VLBI, SLR and DORIS, have all developed and evolved independently, and all have unique strengths and weaknesses that must be dealt with in integrating data from these systems.
Our approach potentially opens the door to direct measurement of baselines between GNSS-VLBI antenna electrical phase centers. Such inter-instrument ties, usually established with conventional survey techniques, are critically important to the formation of the ITRF because these measurements provide a relation between the two independent techniques. Figure 1 provides a conceptual picture of our proposal. However, the low gain of the standard GNSS antennas, and the limited frequency range over which they operate, would seem to make this an unlikely concept.
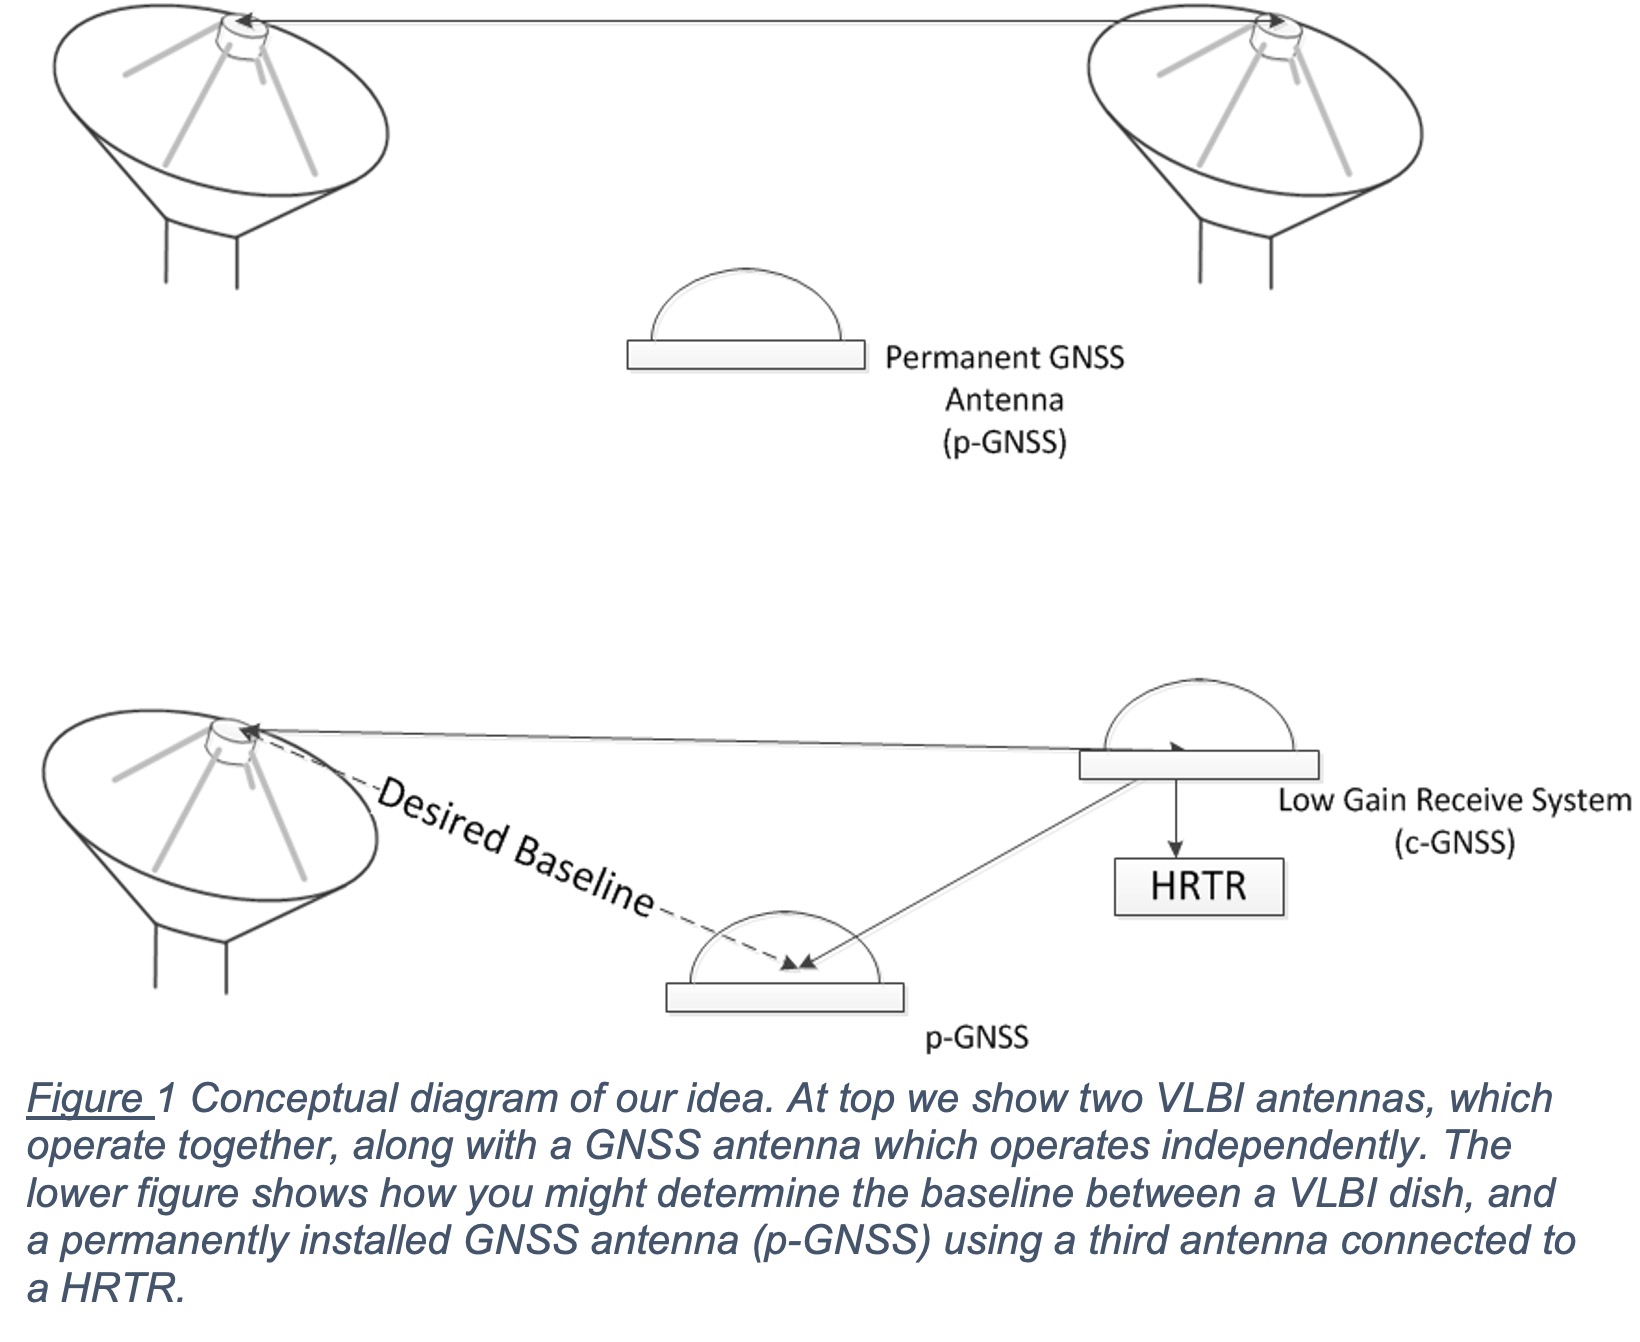
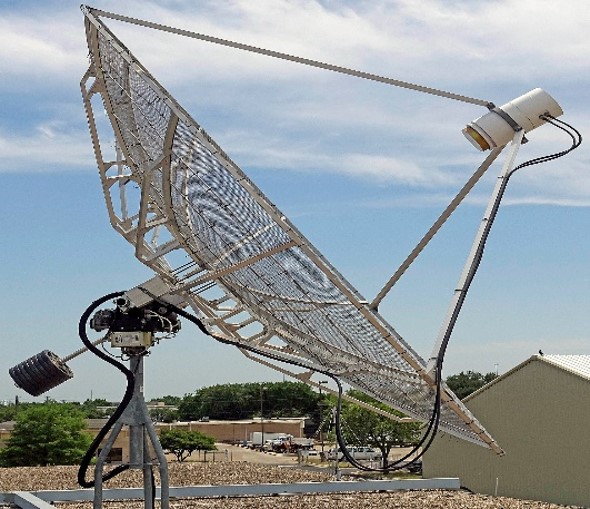
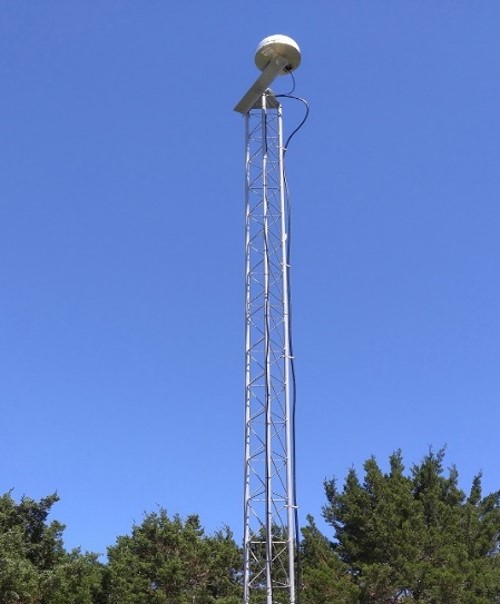
To investigate our question, we have performed some initial experiments to observe bright celestial sources through a combination of small 3-m dish antenna and a modified low-gain GNSS antenna and the High Rate Tracking Receiver (HRTR) – effectively a mixed antenna interferometer. The HRTR is a Field Programmable Gate Arrays (FPGA)-based software receiver developed to allow high-rate observations of GNSS signals. This allows us to perform many of the same observations as a dish antenna by substituting integration time for the signal gain provided by the dish. Examples of the antenna we used are shown in Figure 2. We used two GNSS antennas on two different baselines – a 16 km baseline (shown in the picture) and a shorter 140 m baseline.
We used a HRTR attached to our dish antenna and one attached to each GNSS antenna. We collected data in different configurations from all three antennas simultaneously, and then used a process called correlation to produce what is known as a Complex Ambiguity Function (CAF) surface. Bright peaks in this surface represent possibly interesting signals.
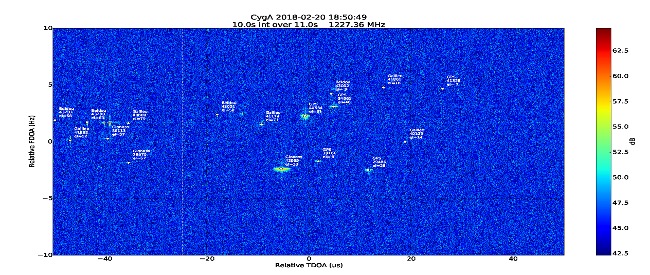
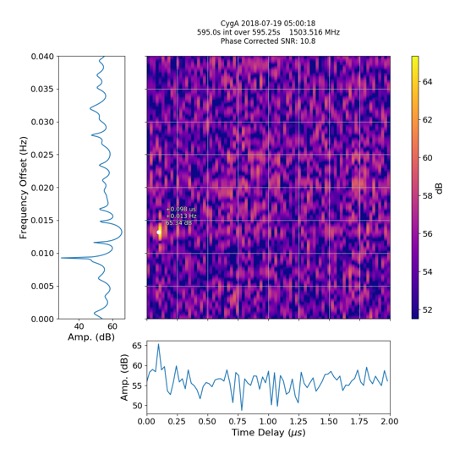
One of the first things we looked for were satellites because they are relatively bright. Figure 3 shows the CAF surface in this case. This observation was for a period of 10 seconds, and the satellites are obvious. We were able to identify and label the satellites in this figure. For a more complex observation we attempted to observe Cygnus-A, a bright radio galaxy powered by a black hole. This observation yielded a tentative detection, shown in Figure 4. This image was formed from data collected on the 140 meter baseline.
These images are encouraging, but we are still working on validating them and extracting useful geodetic measurements from them. Only by doing so will we be potentially able to extract baseline measurements between VLBI dishes and GNSS antennas.
This work has been funded under NASA Grants NNX17AD29G and 80NSSC20K1732, along with support from ARL:UT internal research and development.
Contact information:
Johnathan York (jayork@utexas.edu)
David Munton (dmunton@utexas.edu)