“Monitoring Earth’s climate variables with satellite laser altimetry” , was recently published in Nature Reviews Earth & Environment by the Center’s Lori Magruder and Amy Neuenschwander on how satellite laser altimetry has provided critical measurements of Earth for multi-disciplinary knowledge of climate impact. Co-authors on the paper include Sinead Farrell and Laura Duncanson of the University of Maryland, Bea Csatho of the University of Buffalo, Sahra Kacimi of the Jet Propulsion Laboratory and Helen Amanda Fricker of the Scripps Institution of Oceanography at UC San Diego.
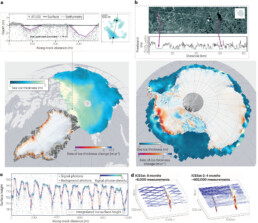
Abstract: Satellite laser altimetry measures accurate elevations of the Earth’s surface and precise changes with time, monitoring key climate variables. These observations have transformed understanding of the Earth System, revealing changes and dynamics across spheres. In this Review, we highlight the Earth and climate science contributions from three NASA satellite laser altimeter missions: Ice, Cloud and land Elevation Satellite (ICESat; 2003–2009), ICESat-2 (2018 to present) and Global Ecosystem Dynamics Investigation (GEDI; 2018 to present). Over two decades of observations, satellite altimetry revealed cryosphere decline, including a loss of 320 Gt yr?1 in global land ice from Greenland and Antarctica, and a 30% decrease in volume of winter sea ice in the Arctic between 2003 and 2021. Observations have also been key to understanding ecosystems on land, providing data on the hydrosphere (showing that 57% of the Earth’s seasonal terrestrial water storage variability comes from human-managed reservoirs) and biosphere (showing that forest carbon stocks have globally increased owing to growth, despite a loss of the equivalent of ~8 Gt CO2 from land use). In the atmosphere, the data have enabled assessment of the global vertical cloud distribution, aerosol fraction, and dust and smoke transport. There is currently no planned satellite laser altimeter mission to continue from ICESat-2 and GEDI, jeopardizing critical data collection that supports decision-making and environmental management.
Source: https://rdcu.be/dxiB7