
Background Information
Recent advances in remote sensing and geographic information has led the way for the development of hyperspectral sensors. Hyperspectral remote sensing, also known as imaging spectroscopy, is a relatively new technology that is currently being investigated by researchers and scientists with regard to the detection and identification of minerals, terrestial vegetation, and man-made materials and backgrounds.Imaging spectroscopy has been used in the laboratory by physicists and chemists for over 100 years for identification of materials and their composition. Spectroscopy can be used to detect individual absorption features due to specific chemical bonds in a solid, liquid, or gas. Recently, with advancing technology, imaging spectroscopy has begun to focus on the Earth. The concept of hyperspectral remote sensing began in the mid-80's and to this point has been used most widely by geologists for the mapping of minerals. Actual detection of materials is dependent on the spectral coverage, spectral resolution, and signal-to-noise of the spectrometer, the abundance of the material and the strength of absorption features for that material in the wavelength region measured.
Hyperspectral remote sensing combines imaging and spectroscopy in a single system which often includes large data sets and require new processing methods. Hyperspectral data sets are generally composed of about 100 to 200 spectral bands of relatively narrow bandwidths (5-10 nm), whereas, multispectral data sets are usually composed of about 5 to 10 bands of relatively large bandwidths (70-400 nm).
Hyperspectral imagery is typically collected (and represented) as a data cube with spatial information collected in the X-Y plane, and spectral information represented in the Z-direction.
AVIRIS hyperspectral data cube over Moffett Field, CA
Applications
There are many applications which can take advantage of hyperspectral remote sensing.- Atmosphere: water vapor, cloud properties, aerosols
- Ecology: chlorophyll, leaf water, cellulose, pigmemts, lignin
- Geology: mineral and soil types
- Coastal Waters: chlorophyll, phytoplankton, dissolved organic materials, suspended sediments
- Snow/Ice: snow cover fraction, grainsize, melting
- Biomass Burning: subpixel temperatures, smoke
- Commercial: mineral exploration, agriculture and forest production
n-Dimensional Data
Hyperspectral data (or spectra) can be thought of as points in an n-dimensional scatterplot. The data for a given pixel corresponds to a spectral reflectance for that given pixel. The distribution of the hyperspectral data in n-space can be used to estimate the number of spectral endmembers and their pure spectral signatures and to help understand the spectral characteristics of the materials which make up that signature.
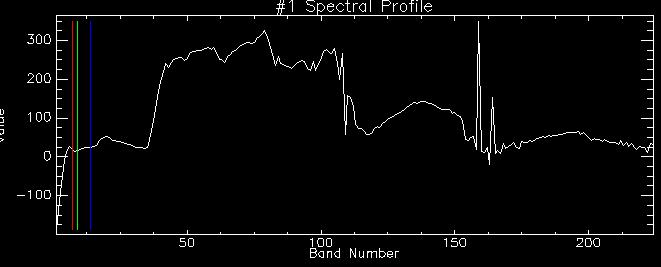
Vegetation Spectral Reflectance extracted from AVIRIS data